Our blog

Insights & news.

Subscribe to get daily insights and company news straight to your inbox.

Streams of blue light racing across a dark landscape at night.
EngineeringDec 15

Building real-time dashboard updates at scale.

Learn how we built a system that processes millions of data points without breaking a sweat, delivering dashboard updates in under 200ms.

James Fischer and Yuki Tanaka
A glowing paper plane made of light streaking across a dark sky.
Company NewsNov 5

Sendimo raises $15M series A to democratize data visualization.

We're thrilled to announce our $15M Series A funding round led by Sequoia Capital, with participation from Y Combinator and industry angels.

Marcus Patel and Elena Volkov
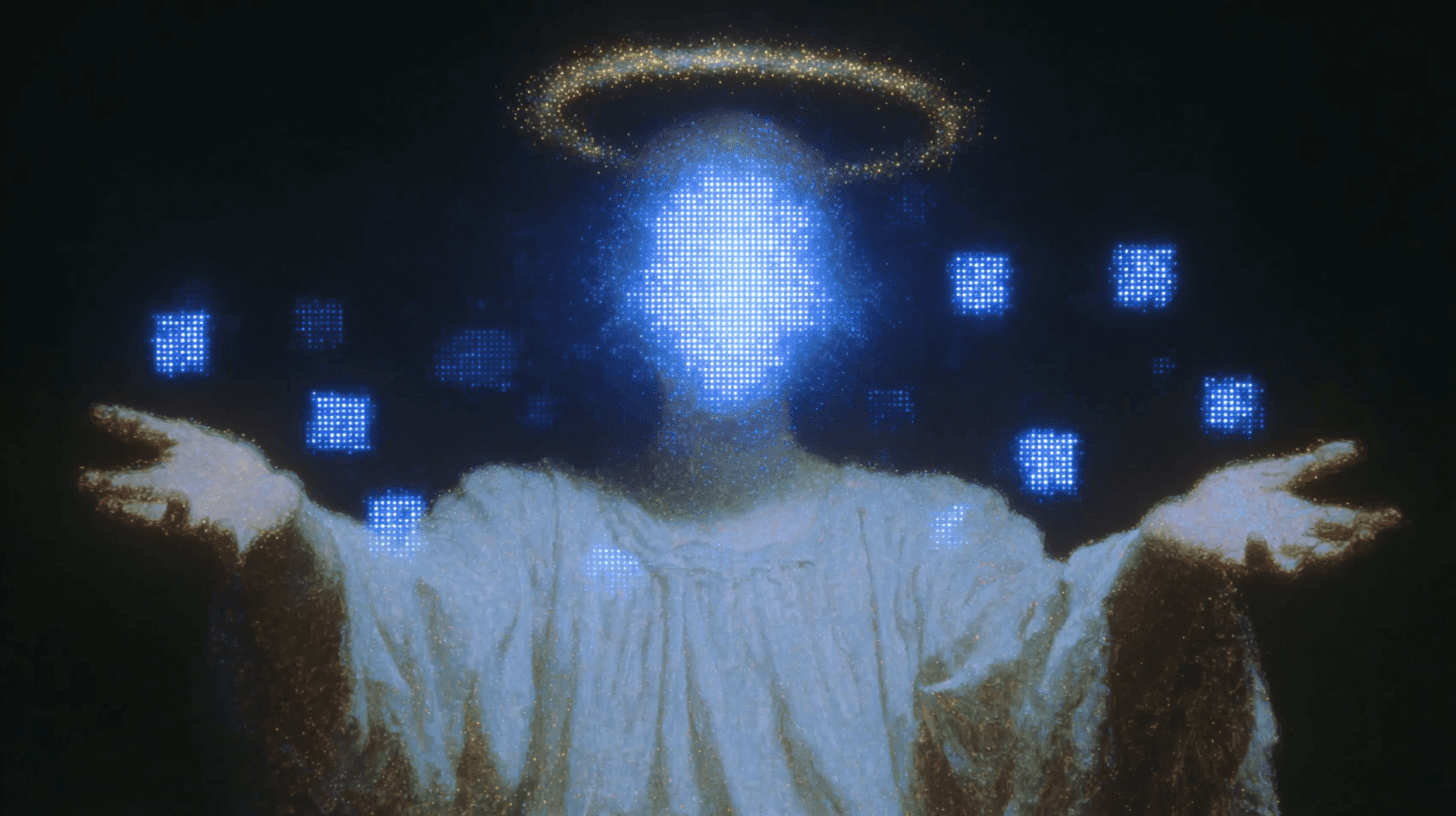
A figure with a glowing head and a halo, surrounded by floating blue squares.
SecurityOct 18

How we keep your data safe in AI processing.

When you upload sensitive business data to Sendimo, security isn't optional—it's foundational. Here's how we protect your information throughout the AI processing pipeline.

James Fischer
A glowing crystal diamond hovering above a figure on a mountain at night.
TutorialsSep 28

5 dashboard design principles that actually work.

Creating effective dashboards isn't about cramming in every possible chart. Here are five principles that separate good dashboards from great ones.

Yuki Tanaka and Elena Volkov
A field of white flowers leading to a small tower under pink clouds.
AI & MLAug 12

How our AI learns your data visualization preferences.

Sendimo doesn't just create charts—it learns how you like your data presented. Here's how our machine learning system adapts to individual user preferences.

James Fischer
Translucent crystal cubes floating in the clouds above a lone figure on a hill.
ProductJul 10

Why we redesigned our chart recommendation engine.

After analyzing 100,000+ dashboard creations, we discovered our AI was missing the mark. Here's how we rebuilt our recommendation system to be 40% more accurate.

Yuki Tanaka and Marcus Patel
A crystal cube with rainbow reflections floating above the clouds.
DesignJun 25

The psychology of color in data visualization.

Color isn't just decoration in dashboards—it's a powerful tool for guiding attention and communicating meaning. Here's how we think about color psychology in AI-generated visualizations.

Yuki Tanaka
A crystal city rising from a sparkling blue landscape.
InsightsMar 8

The state of business intelligence in 2025.

We surveyed 1,000 business teams about their data visualization challenges. The results reveal why traditional BI tools are failing modern teams.

Marcus Patel

Ready to send your SMS?

Launching soon in Tunisia. Join early access.